

Graphs and Data Analysis
Learning Objectives
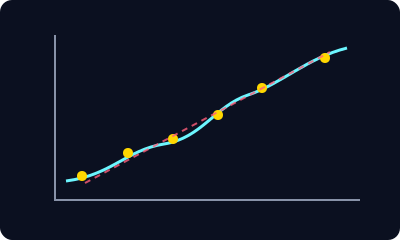
- Students will be able to plot data on x-y graphs and identify relationships
- Students will be able to read data from graphs and interpret slope and intercepts
- Students will understand interpolation and extrapolation
Core Concepts
- Independent and dependent variables
- Linear relationships and slope
- Using graphs to extract information from data
Formulas
$$\text{slope} = \frac{y_2 - y_1}{x_2 - x_1}$$
Slope of a line representing rate of change
Interesting Fact
Florence Nightingale pioneered data visualization to communicate statistical information
Key Scientist
René Descartes
Developed the Cartesian coordinate system for plotting graphs
Philosophy
Graphs are visual representations of data that allow us to analyze patterns, trends, and relationships. The choice of axes and scale reflects decisions about which variables to focus on and how to best display the information. Careful consideration of these design choices is important for effectively communicating scientific findings.
Want to truly master this? Try the interactive lesson!
Start Lesson